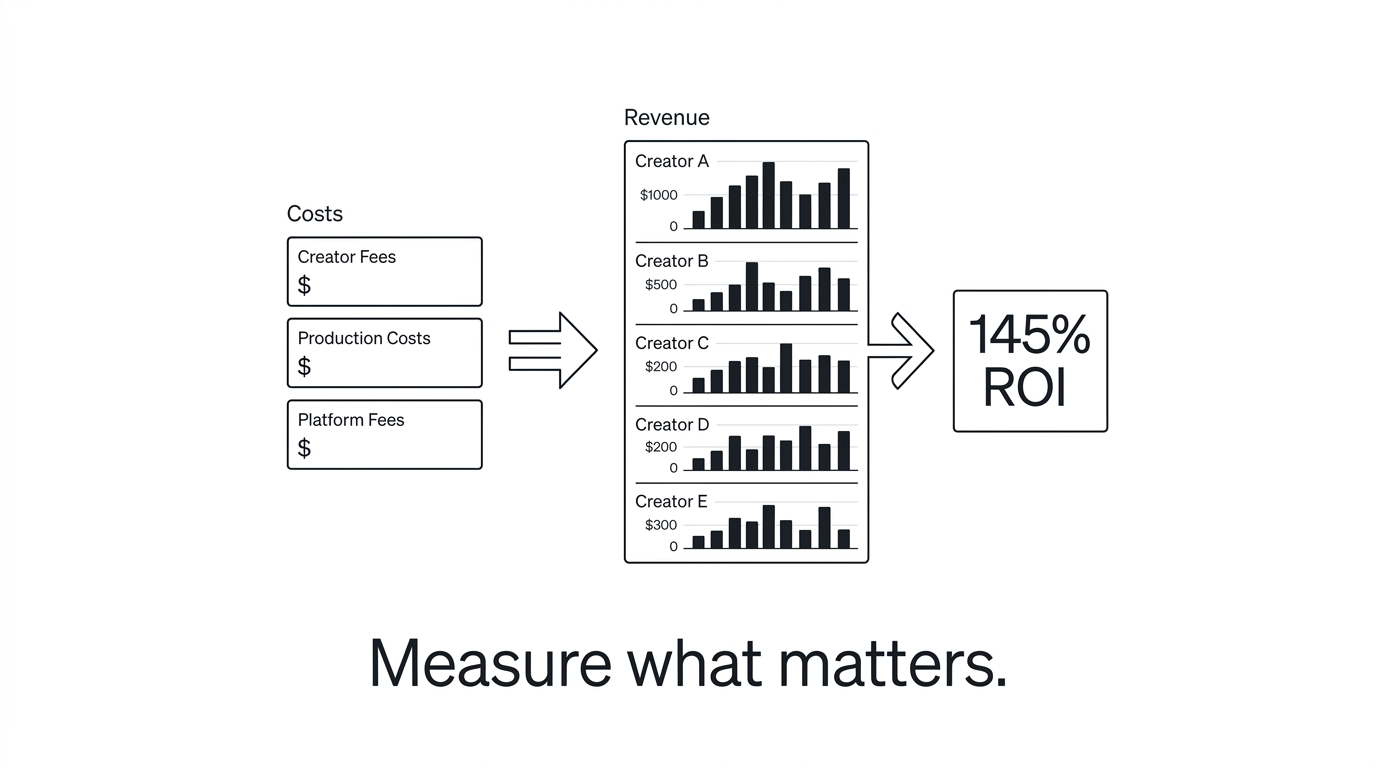
How to Measure UGC ROI for Your Mobile App
Most teams can't answer "is our UGC working?" Here's how to measure creator content ROI with actual revenue data instead of vanity metrics.
I have a standard conversation with app developers. They’re spending $5K-$15K a month on UGC creators. Some of the content is great. Installs seem fine. But when the founder or the head of growth asks “what’s the ROI on this?” everyone stares at a spreadsheet full of view counts and engagement rates and sort of waves their hands.
People aren’t being lazy. The default metrics for UGC are just vanity metrics. Views, likes, shares, comments, none of these tell you whether a creator’s content is making you money. A TikTok with 800K views and a 4% engagement rate looks amazing in a campaign report. But if it drove 12 installs and none of them converted to paid, its actual value to your business is zero.
According to a 2025 Aspire report, 67% of brands say measuring ROI is their top challenge with influencer marketing. That accords with my experience. Most teams are flying blind and filling the gap with hope.
What metrics actually matter for measuring UGC ROI?
It's time to get rid of vanity metrics and focus on what really matters. There are only 5 metrics you should really care about: Installs per creator. Not total installs generated by the campaign, but installs per each specific creator. This is a must, without it, you have no other data to rely on. We already wrote about how to track results on a per-creator level in our guide to tracking which UGC actually drives app installs . Paid conversion rate per creator. How many installs generated by each creator actually converted into paying customers? Here is where you'll start to see differences between creators. According to a 2025 Liftoff study, the average purchase rate for subscription apps was at 3.5% from paid sources. We've seen many creators deliver purchase rates of 6-10% or more, since users arrive with more intent and context. However, there's a large disparity between individual creators, while one may deliver a 15% rate, another might not deliver any purchases at all. Revenue per creator. The total revenue you've generated that you can attribute back to each specific creator, not an estimate, but actual revenue. In order to get to this number, you'll need to integrate your attribution data with your payments or subscription platform, but once you do, you'll have a concrete number. Cost per paying user. What did you pay each creator (flat fee, content production costs, revenue share, etc.) and how many paying customers did they drive? This will be the metric that allows you to compare your creator spend to your paid ad spend. LTV of referred users. Do users referred by Creator X have better retention than users referred by Creator Y? And how does that compare to users acquired from paid advertising? A 2025 AppsFlyer study found that organically-acquired and referred users have 25-30% better 90-day retention compared to paid acquisition users. If users referred by your creators retain better than your other channels, your ROI will only improve over time.
How do you calculate the ROI of a specific creator?
The formula is simple. The tricky part is getting the variables. ROI = (Attributed Revenue - Creator Cost) / Creator Cost Okay, let's do an example. You're working with Creator A: - You paid them $1,200 for a month of content (two TikToks, one YouTube short) - Their tracking link drove 280 installs - 22 of those installs converted to paid subscribers at $9.99/month - In the first month, attributed revenue: $219.78 Month 1 ROI: ($219.78 - $1,200) / $1,200 = -81% Yikes. Except that those 22 subscribers don't just pay you once. If even 15 of them are still subscribers in month three, that's another $449.55 in revenue from that same batch of content. By month four, Creator A has generated about $880 in cumulative revenue. And by month six, assuming typical subscription retention, you're in the black. That's why LTV is such a critical piece of calculating creator ROI. If you only look at month one, almost every creator will look like a terrible investment. Subscription revenue is inherently back-loaded. You have to model it out. And here's the key comparison: what's your CPA from paid ads? According to Sensor Tower's 2025 benchmarks, the average cost per subscription acquisition from paid social is $28-$45 for most app categories. If Creator A drove 22 subscribers for $1,200, that's $54.55 per paying user, which looks bad at first blush. Except if those users retain 30% better than ad-acquired users, your effective CPA decreases significantly over the lifetime of the subscriber.
Is revenue share or flat fee better for measuring ROI?
Why revenue share? It keeps your data clean. That’s it.
Flat fees require post-factum analysis. “We paid $1,500, they drove X revenue, what was the ROI?” The creator doesn’t see the revenue so there’s no feedback loop to optimize against. They just make content and pray.
With revenue share (say 20% of subscription revenue for 12 months), the ROI is baked into the model. You never overpay for a creator who fails because their payment is based on performance. The worst possible outcome is a creator who drives $0 revenue and costs you $0.
The downside is that revenue share is harder to recruit against. Creators unfamiliar with your product must believe their audience will convert. The solution is to show them your data. “Our average creator earns X per month through revenue share” is a stronger pitch than “we’ll pay you $200 for a TikTok.” (If you’re figuring out commission models for the first time, we cover the options in our guide to launching an affiliate program.
A good middle ground for kicking off a program: pay a small flat fee ($200-$500) for the first post, then shift to 100% revenue share. You’re paying for the creator’s attention, then letting the economics play out.
How do you connect attribution data to revenue tracking?
You have to connect the dots between two data points: 1. Install attribution (which creator brought in which install), and 2. Revenue tracking (what those users spent). The first part, install attribution, involves issuing each creator a unique promo link and integrating an attribution SDK that matches installs back to those links. On Android, you get this done using the Google Play store's install referrer. On iOS, it's trickier, as we went over the Apple iOS technical details of post-IDFA attribution . The second part, revenue tracking, involves hooking up your subscription and payments API. If you're on RevenueCat, that looks like this:
Appfiliate.configure(appId: "APP_ID", apiKey: "API_KEY")
Appfiliate.trackInstall()
Appfiliate.setUserId(Purchases.shared.appUserID)
Appfiliate.configure(this, appId = "APP_ID", apiKey = "API_KEY")
Appfiliate.trackInstall(this)
Appfiliate.setUserId(this, Purchases.sharedInstance.appUserID)That setUserId call is what links the attribution to the revenue. Every time RevenueCat processes a purchase or renewal, it sends a webhook that attributes the revenue to the publisher who brought in the install. No manual tracking, no spreadsheets. If you're using Stripe for payments, same concept, pass the Stripe customer ID instead. The webhook takes care of the rest. Without this, you have to match up install dates with revenue bumps and hope the two numbers are in the same ballpark. With this, you have actual revenue by publisher reports.
What does real-world creator ROI data look like?
Scenario 1: Here is an example of what the above data could look like in the real world for an app priced at $9.99 per month using a creator program that featured 6 creators for 30 days: CPA calculated using revenue share payout as cost. *Revenue share ROI is inherently positive because the cost is based on revenue generated. There are a few obvious conclusions to draw here: Creator E (on revenue share) is your rockstar! You have 520 installs, 38 paid users and a 7.3% conversion rate. Your CPA is less than $20 which is better than nearly every paid acquisition channel out there. Do whatever it takes to get more of their content! (Early access to new features, bump them to the highest commission tier, etc.) Creator D is pure garbage. 40 installs, 2 conversions and a $250 CPA. Even accounting for LTV, this just isn’t going to work. Get rid of them, or convert them to revenue share and contain the damage. Creator F actually generated 0 paid users. That $300 is just gone. If they were on revenue share, it would have cost you nothing. Creator A has the second highest amount of installs behind only Creator E but the conversion rate is lower. It’s worth letting them continue for another month to understand the subscriber retention, but be careful.
When should you cut, keep, or double down on a creator?
This is where things get emotional. Someone's a great creator, communicative, good content, etc...but people don't convert. Or they do convert, but churn after 2 weeks. The math has to win out.
Cut when: CPA is 3x or more your target after 60 days. Or conversion rate is below 2% consistently. Or referred users churn at significantly higher rates than your baseline. Give creators at least 30 days and two pieces of content before deciding, as one bad TikTok isn't a trend. Double down when: CPA is at or below your paid ad benchmarks. Conversion rate is above 5%. Referred users retain as well or better than organic. These are your engines. A 2025 CreatorIQ benchmark report found that top performing creator partnerships return 4-7x ROI over a 6 month period...but only if teams actually identify and double down on their top creators instead of spraying and praying budget. Move to revenue share when: A creator can get you installs, but conversion is so-so. Revenue share manages your downside and leaves upside on the table. If their content gets better, or their audience evolves, you win. And if not, you're not hemorrhaging flat fees.The biggest thing I see teams doing wrong is treating all creators as equal. Equal budget, equal attention, equal contract terms. Your top 20% of creators will deliver 80% of your revenue, as this isn't a hypothesis, this is just how the math works. Measure on a per-creator basis, and invest accordingly.
Why should you stop reporting on views and engagement rate?
No, seriously, stop reporting on views and engagement rate as your main metrics. They’re just context. A creator’s TikTok getting 2M views is nice for their career. It tells you almost nothing about whether your app made money from it. The numbers that matter are installs, conversions, revenue, CPA, LTV. Everything else is noise that makes bad creators look good and good creators look average. Get attribution set up, plug in revenue tracking, and let the numbers decide. If you need help deciding between attribution platforms, we wrote a comparison of the main options. That’s how you answer “is our UGC working?” with something other than a shrug.